NIPS paper acceptance: GCA
I learned yesterday that a paper that I have been developing over the last several years has been accepted into this year’s Advances in Neural Information Processing Systems (NIPS) conference.
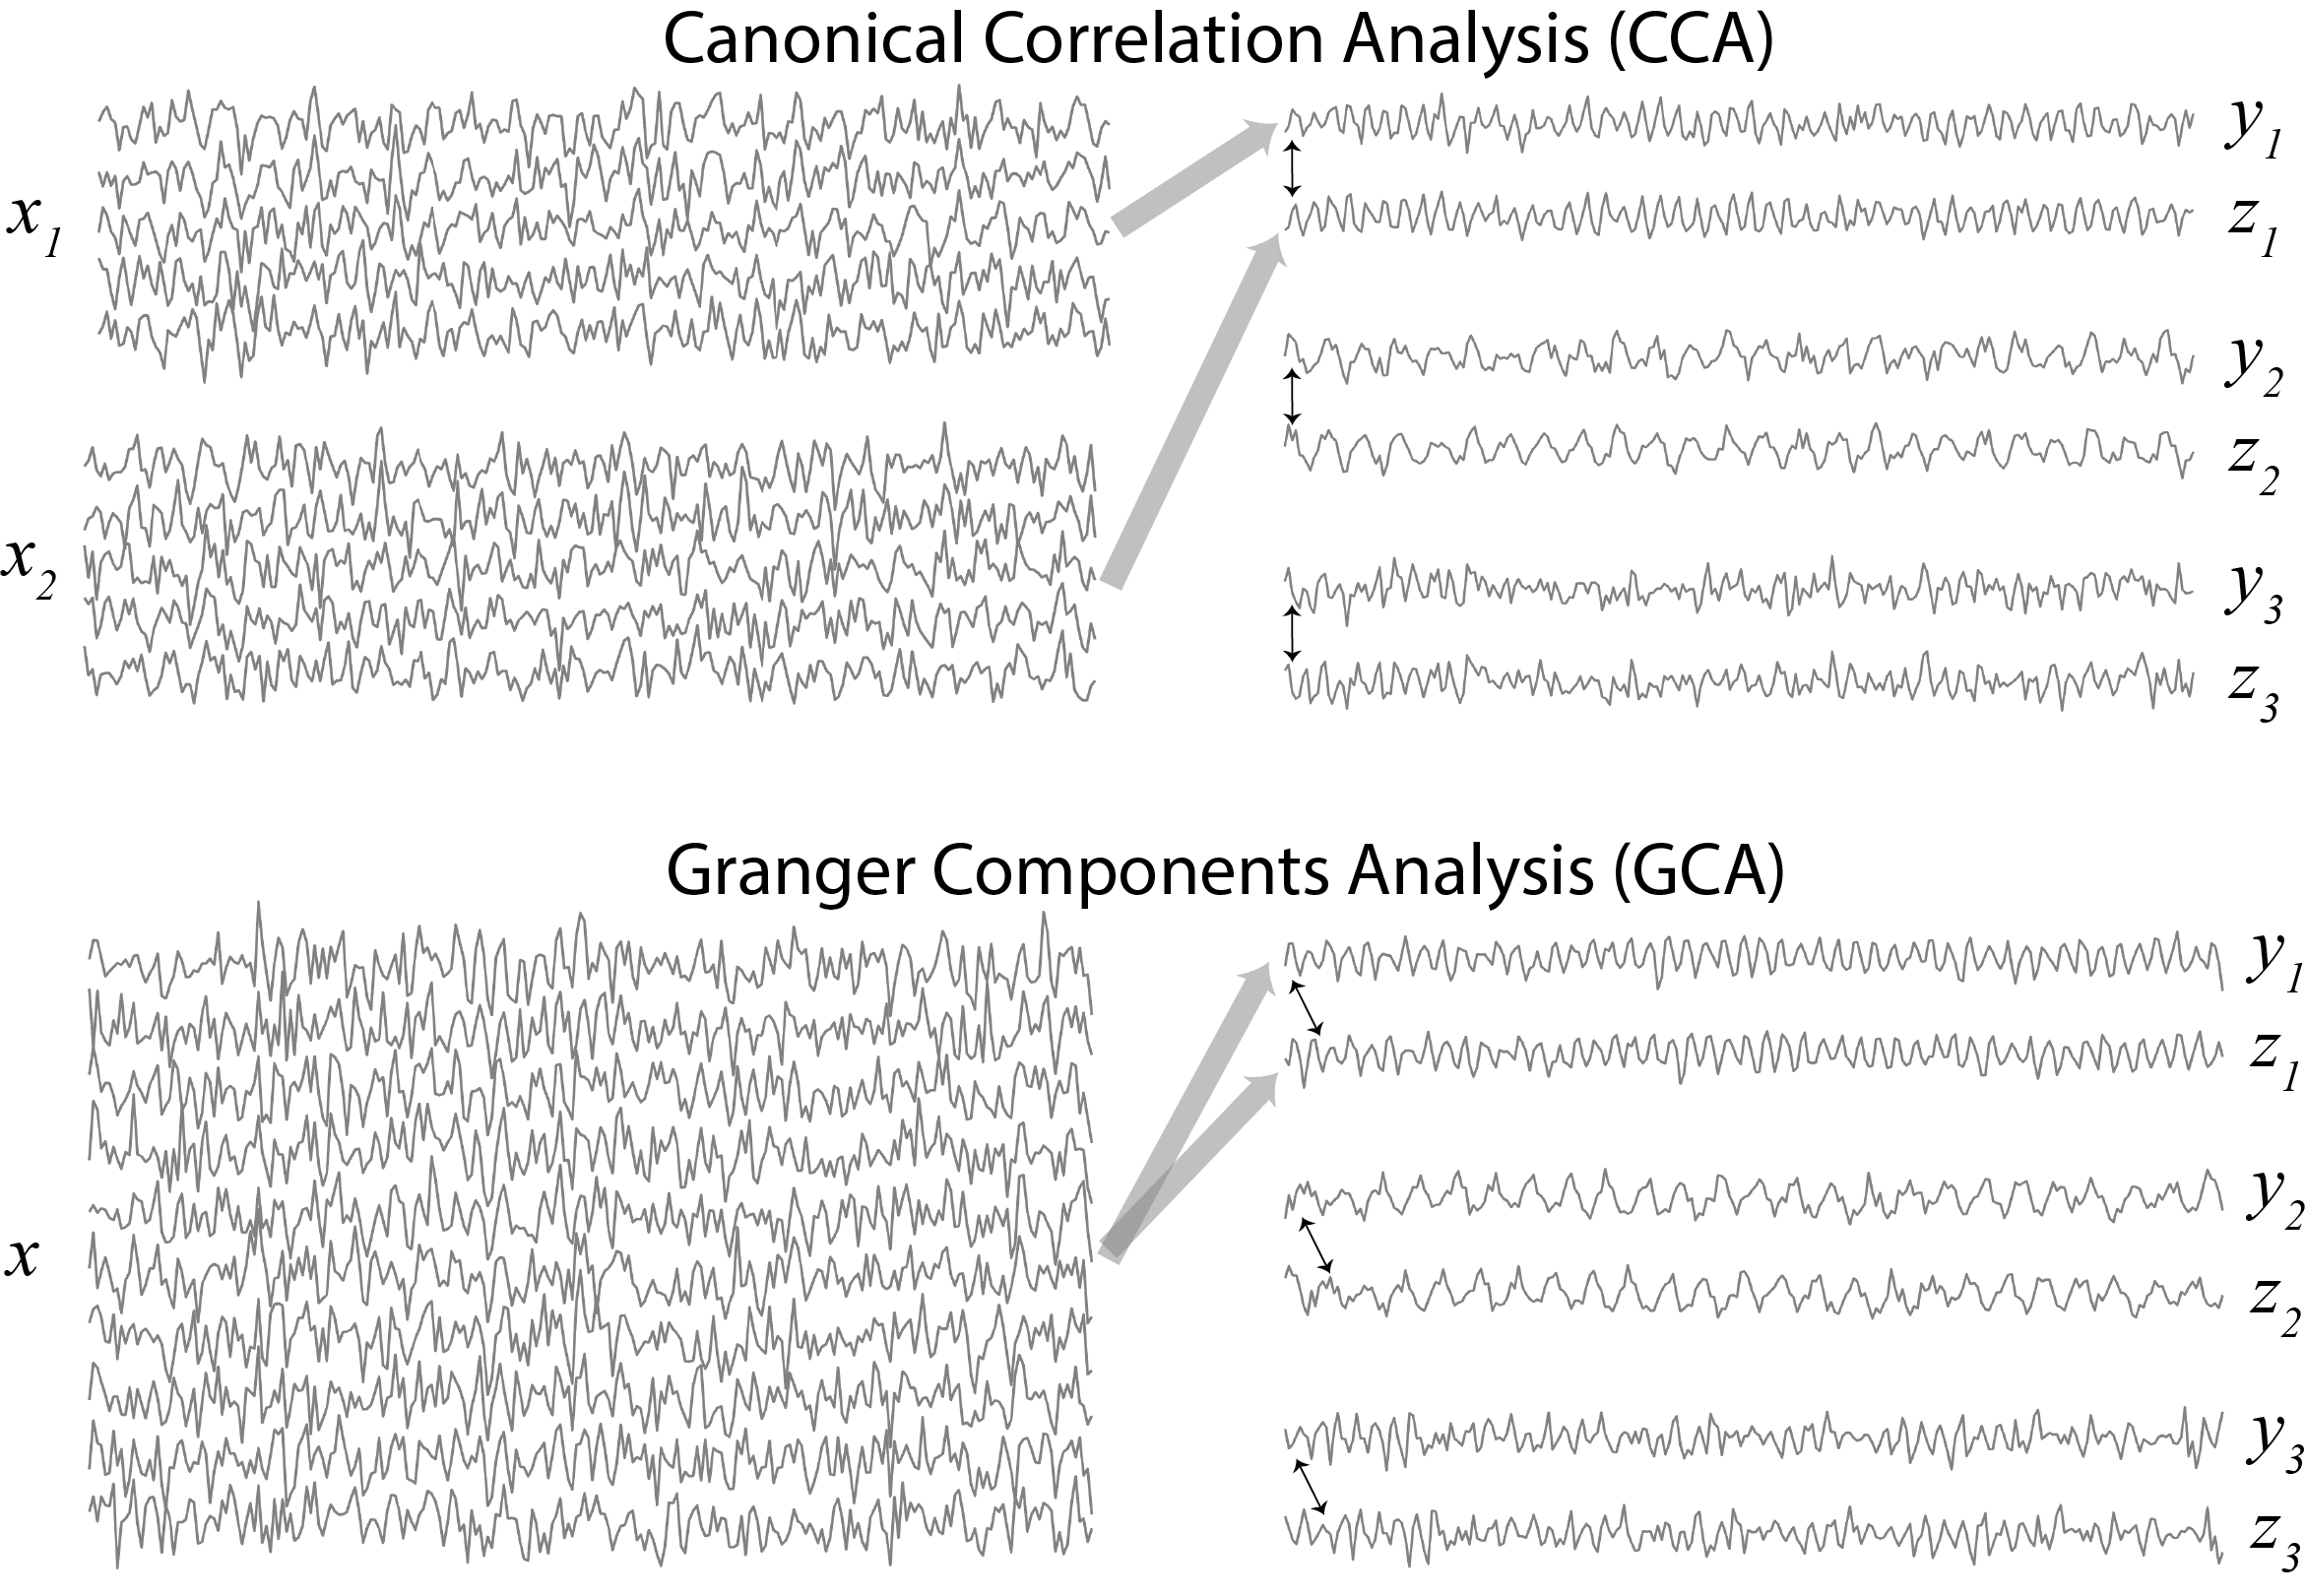
The paper proposes a method – “Granger Components Analysis” (GCA) – for blindly learning the Granger causal relationships in your data. You can think of it as a version of Principal Components Analysis (PCA) where you are:
- Not learning components but rather pairs of components.
- The criterion that is being maximized is the strength of the Granger Causality from one signal to the other in the component pair.
You can also think of it as a version of Canonical Correlation Analysis (CCA) but where:
- The input is not two views of a dataset but rather a single multivariate record.
- We are interested in maximizing not instantaneous correlation but rather lagged correlation (past of one signal predict the other)
Finally, it may also be thought of as the opposite of Independent Components Analysis (ICA). Instead of generating signals that are statistically independent, GCA seeks to find precisely the statistical dependencies in your data. The types of dependencies that it learns are again of the Granger Causal form, where the past of one signal forecasts the present of another.
For now, I am posting the title and abstract of the paper below.
Title: Granger Components Analysis: Unsupervised learning of latent temporal dependencies
Abstract: A new technique for unsupervised learning of time series data based on the notion of Granger Causality is presented. The technique learns pairs of projections of a multivariate data set such that the resulting components – “driving” and “driven” – maximize the strength of the Granger Causality between the latent time series (how strongly the past of the driving signal predicts the present of the driven signal). A coordinate descent algorithm that learns pairs of coefficient vectors in an alternating fashion is developed and shown to blindly identify the underlying sources (up to scale) on simulated vector autoregressive (VAR) data. The technique is tested on EEG data from a motor imagery experiment where the resulting components lateralize with the side of the cued hand, and also on fMRI data, where the recovered components express previously reported resting-state networks.